
Confidence Meter
Breakout or Bust Meter
Create and share prospect shortlists. No accounts required — every list gets its own URL you can bookmark or send to friends. Choose whether your list is public, unlisted (URL-only), or password-protected for viewing. All lists require an edit password so only you can modify them.
Select a game situation and pitch location to determine whether an ABS challenge is worthwhile.
Or enter raw plate_z with zone bounds:
Explore and compare challenge break-even points by situation
To read much more about all this, check out our full article on challenge strategy.
Our break-even points are calculated as the points at which the expected run value of using a challenge is the same as the opportunity cost of using that challenge. Expected run value is straightforward—it’s the odds of getting a challenge right multiplied by the swing in run expectancy generated by flipping the call. To find that, all you need to know is the situation–runners on, count, outs–and the run leverage associated with it.
Opportunity cost is where things get trickier. This is dependent not just on the game state, but also the inning, number of challenges remaining, and the score. Opportunity cost goes down significantly as the game goes on, because the odds of encountering another challenge situation with a better expected value gets lower as there are fewer and fewer pitches remaining to be called. The same goes for challenges remaining–if you only expect to get one more challenge opportunity in the game, it’s a very different equation (literally) to decide whether you’re willing to challenge a pitch if you have one or both challenges remaining. Score also plays a role–not because it changes the importance of runs (a run is a run, whether it’s a tie game or a blowout), but because it determines how likely you are to have to face the bottom of the 9th and the additional potential challenge opportunities it will provide.
Our break-even scores are different from any others we’ve seen out there because they are dynamic and take all these factors into account. Explore for yourself in the visualizer how different break-even points can be in seemingly similar situations!
Turning to the challenge evaluator (and quoting from the aforementioned article): The red hexagons show which pitches are most often called strikes, the blue likely balls, and the yellow outlines the “challenge boundary,” which represents where (from a hitting perspective) called ball percentage equals the challenge break-even rate (for pitchers it’s where that equals the called strike percentage). For hitters, “good” challenges are those made outside the boundary. For pitchers, it’s inside. As the break-even point decreases, the yellow border shrinks for hitters and widens for pitchers, indicating the increased aggressiveness encouraged by the situation.
Obviously, hitters and pitchers don’t know exactly which of these zillion hexagons a pitch will be assigned to in the Statcast data. And, it may seem weird to sometimes give good challenge scores for challenges on pitches called correctly, and bad challenge scores for pitches called wrong. But, what we get at here is an estimation of how sure players are when they challenge pitches in specific locations, which we can then use to evaluate the efficiency of their and their team’s challenge strategy.
| Term | Explanation |
|---|---|
| Break-Even Point | The minimum confidence threshold needed for a challenge to be worthwhile in a given game situation. |
| Confidence | The estimated probability that the umpire's call was incorrect, based on pitch location data. |
| Called Strike Percentage | The historical percentage of pitches at a given location that are called strikes. |
| Margin | The difference between your confidence and the break-even threshold. Positive means the challenge is advisable. |
A Hub for MLB Prospect Projections, Research, and Rankings
Oyster Analytics is the passion project of two former college ballplayers who have an unhealthy devotion to baseball. Founded in 2024, Oyster was initially born out of an idea for a different approach to prospect modeling. Rather than focusing on rankings above all else or making laughably precise projections about individual future stats (let's be honest, no one can actually say to the point what Luis Peña's OPS will be in 2031), we wanted to assess players in terms of the distribution of their potential career outcomes. We were also tired of the flaws of regression models, and wanted to create a tool that utilized a more robust approach (we use a system of more than 100 random forest models).
Since then, Oyster has expanded into a wider array of research. We partner with Down on the Farm Substack to write weekly research articles on all things baseball. We have also worked with our former college program to optimize in-game strategy. We have a few more projects in the works that we'll be launching over the offseason, when we actually have some time to take a step back and grow our offerings. Stay tuned for many more exciting pearls!
We're biased of course, but we really do think these are the strongest MLB prospect projections out there. But don't take our word for it, check them out for yourself.
So what makes our projections and rankings so great and different? Well, they're based on a robust multi-level assemblage of more than a hundred random forest models trained on 15 years of data from all affiliated baseball. These models can capture the complexity of prospect profiles in a way that regression-based models simply cannot. Furthermore, our projection of different levels of MLB productivity is a unique output that allows for an easier understanding of the distributions of the expected future value of a prospect. We are reflexive in our prospect projection, highlighting and learning from our misses, rather than hiding and burying the evidence.
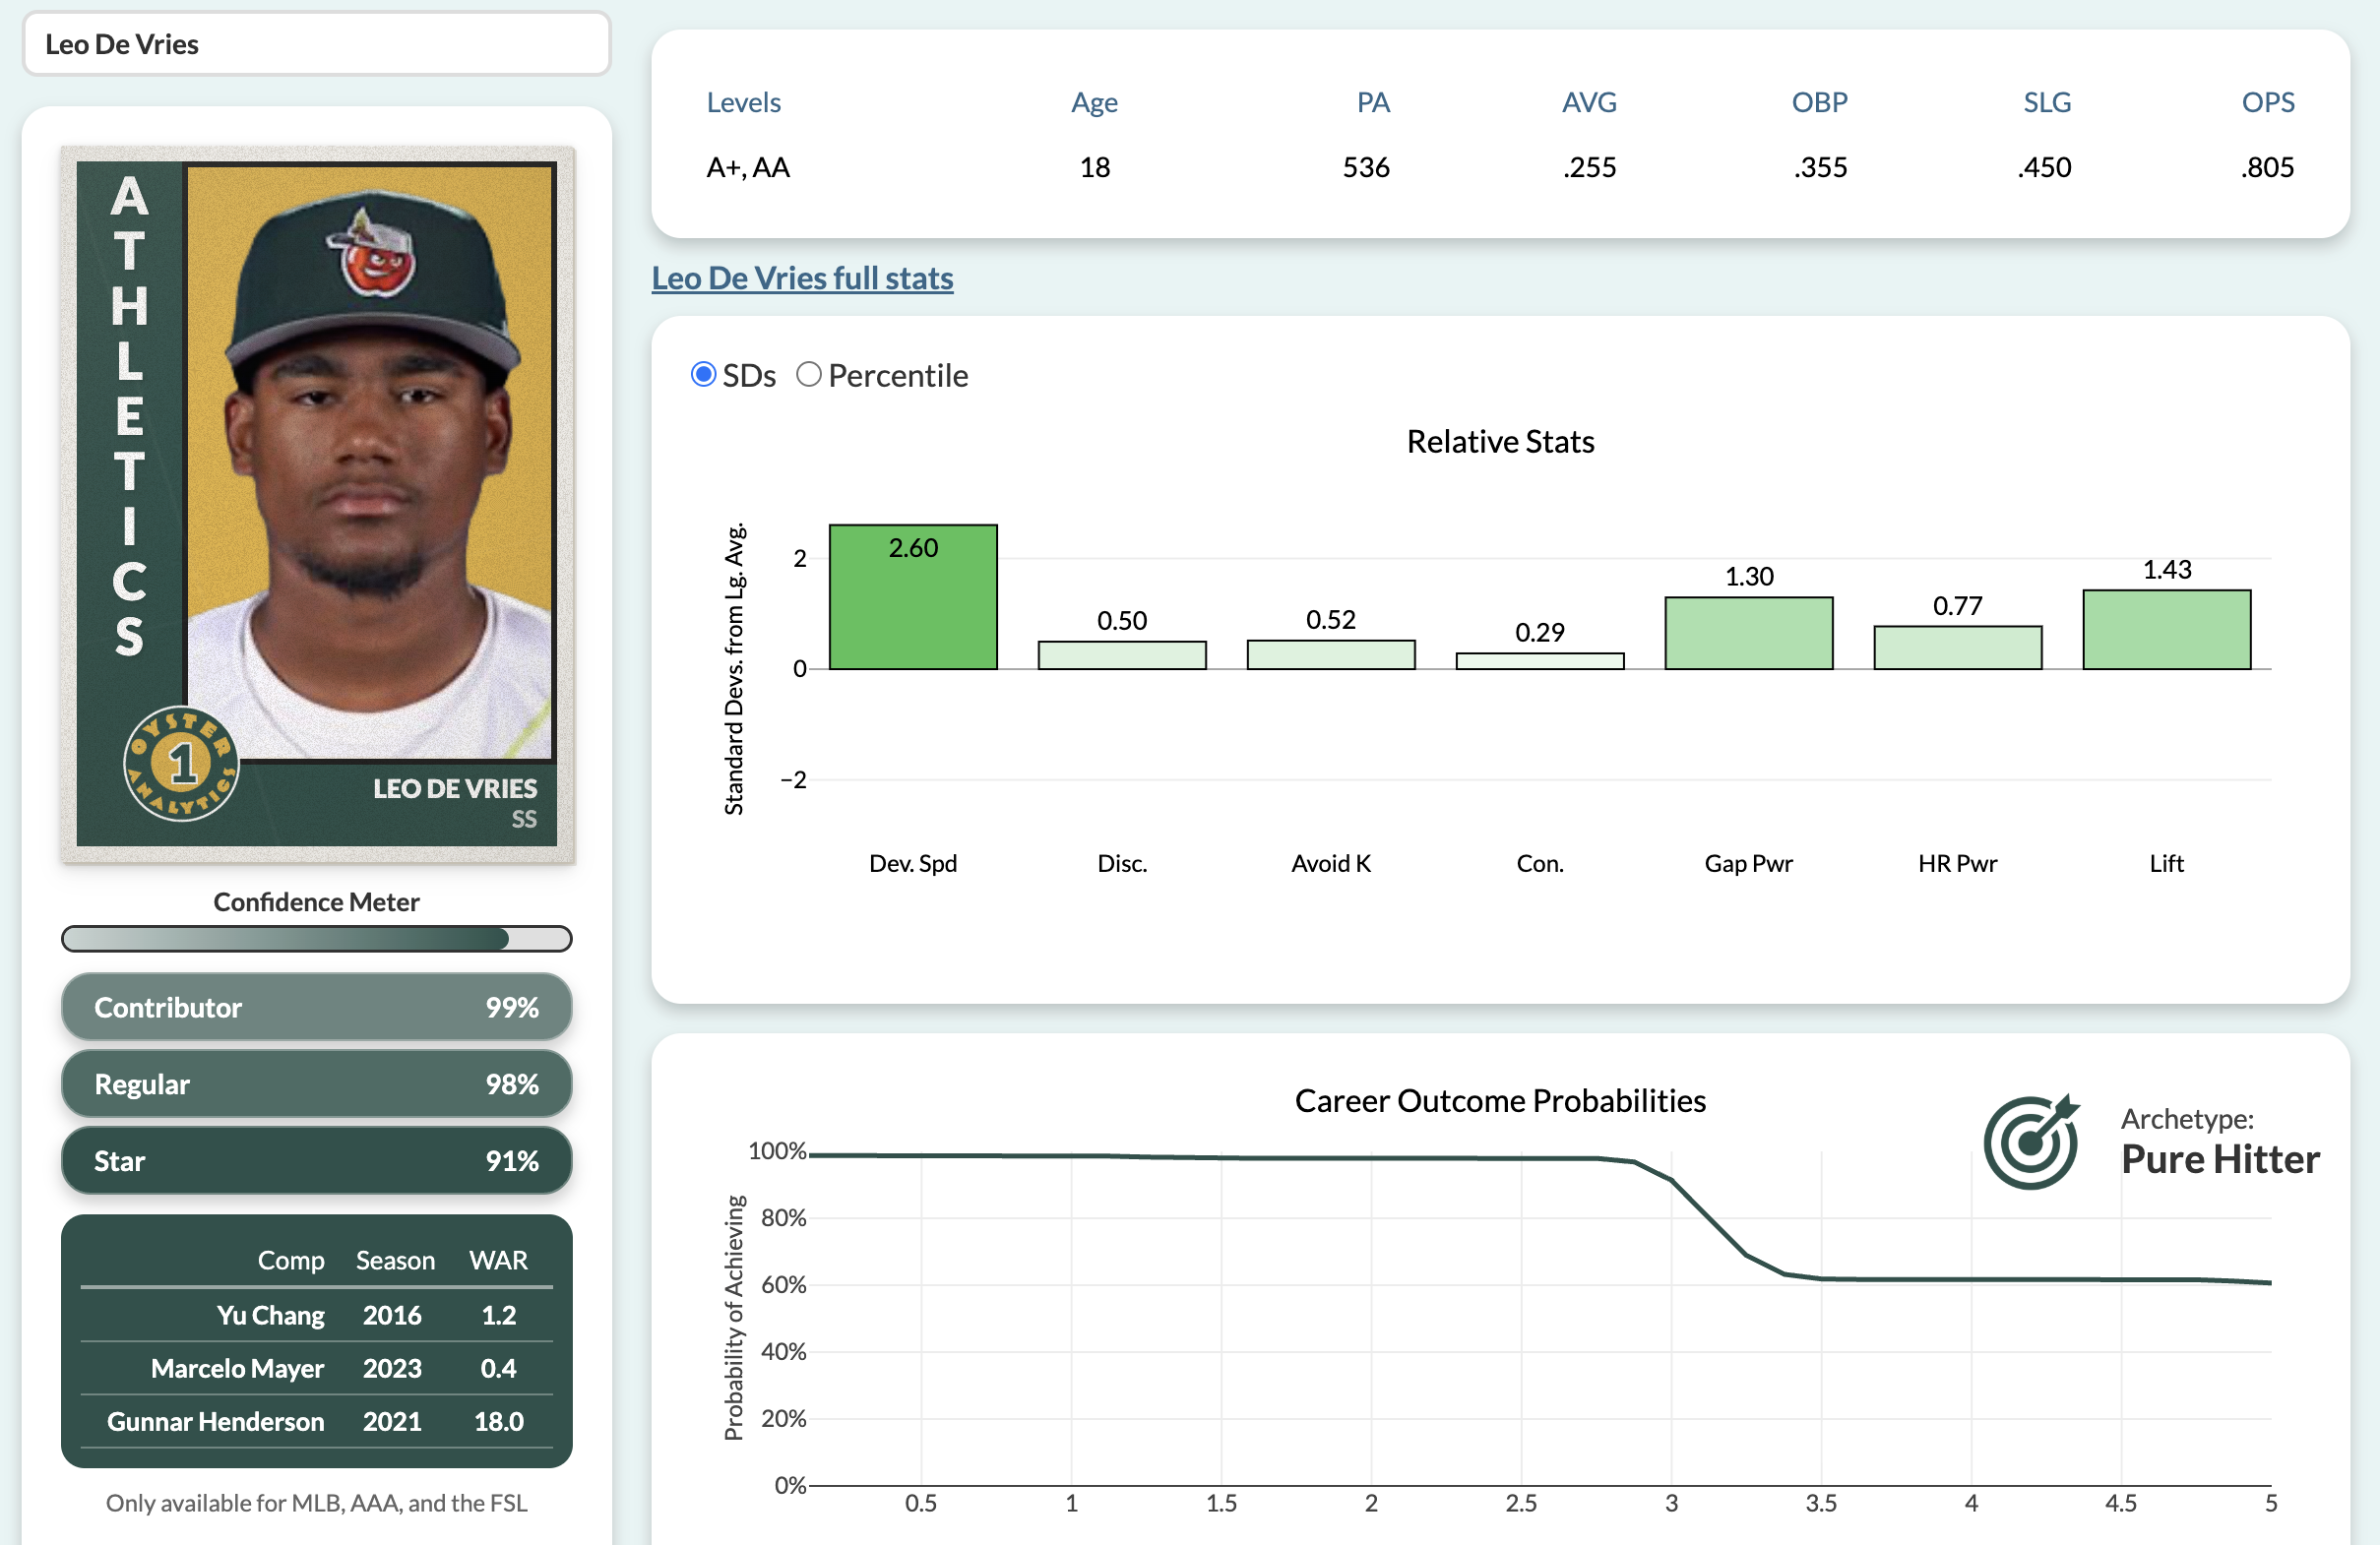
A screenshot from our shiny app featuring Oyster darling Leo De Vries
Since January 2025, we've been writing (at least) weekly articles for the Down on the Farm Substack. This is where we go deeper into our prospect evaluations and publish our wider ranging research projects. Some of our favorite research deep dives have been our analyses into how caution is costing teams on the base paths, ABS-related strategy, and where money is best spent in amateur player acquisition. You can also check out our pre-season top 50 hitting prospects, self-audits of our previous hot takes, and Beatles-themed prospect evaluations.
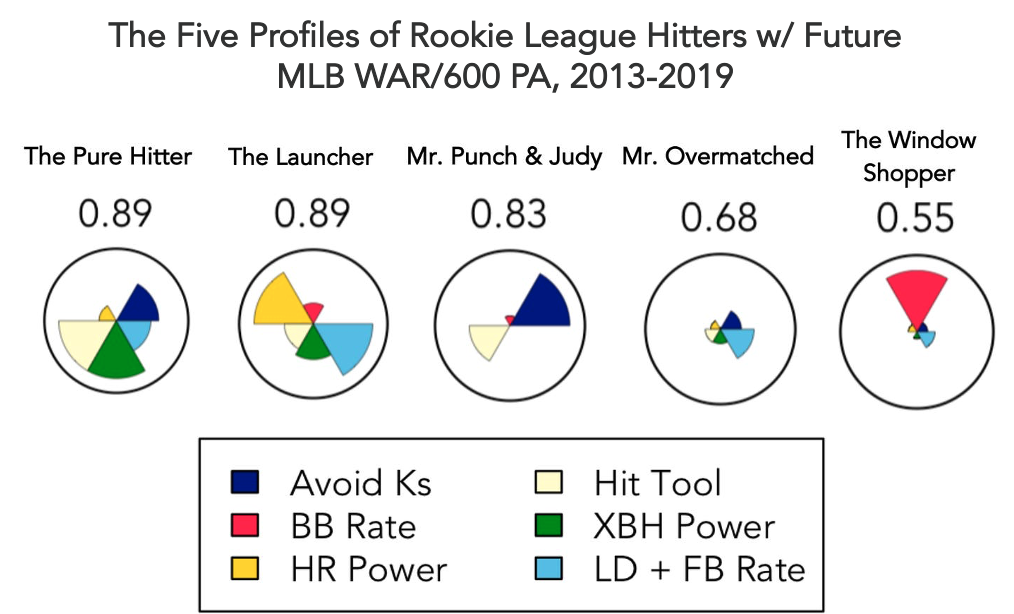
A sampling of our research with Down on the Farm, from an article in which we used self-organizing maps to identify the most common clusters of MiLB hitters and evaluate their MLB potential
Subscribe to the Substack here, and give Down on the Farm a follow on Twitter and Blue Sky!
Everything we've written about every player. Click a player's name to open their card.
Three of our proudest accomplishments (and two things we've gotten wrong)
We investigated send decisions rounding third and found that teams are far too cautious in sending players home, especially with two outs. Featured on Fangraphs' Effectively Wild podcast with Ben Lindbergh and Meg Rowley!
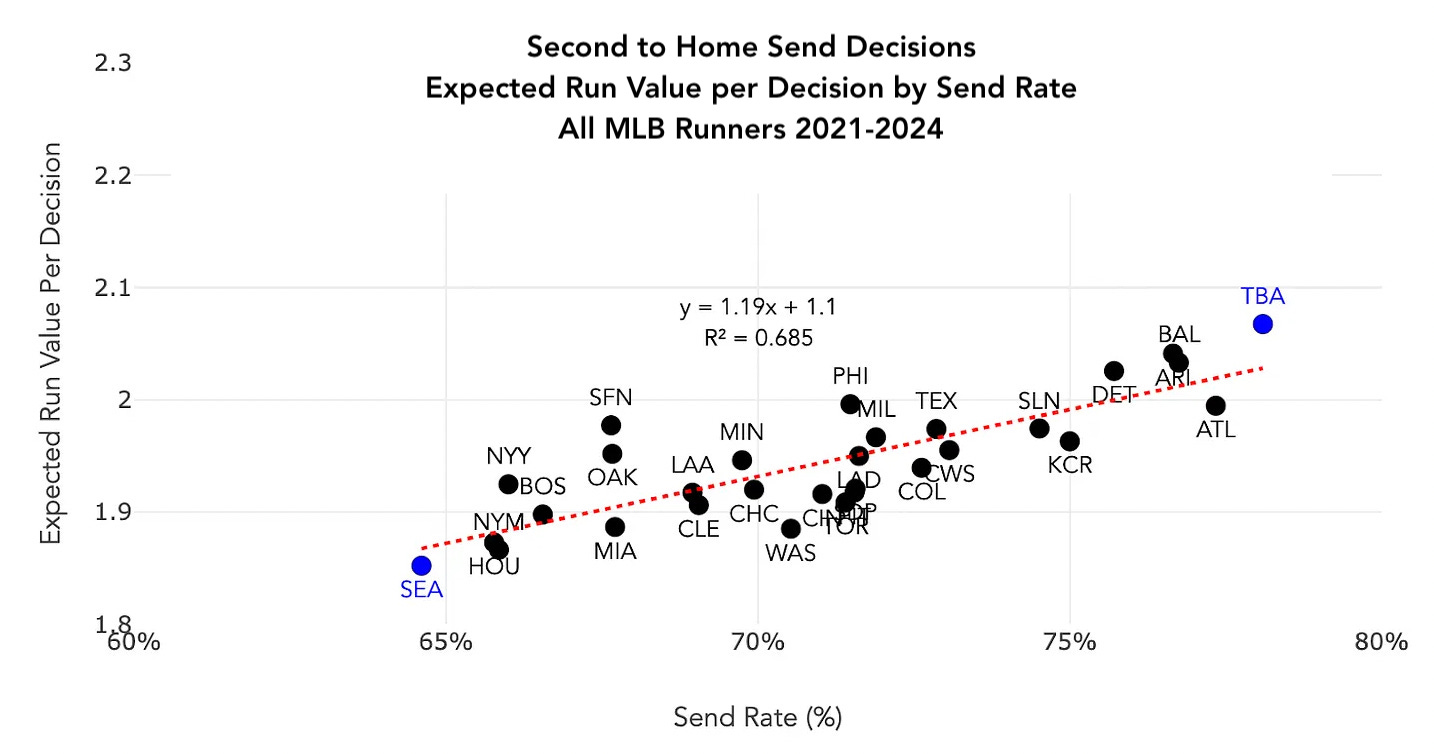
We found a strong correlation between sending runners more aggressively and expected runs generated per send decision
One of these guys is now an all-star and the other three are fashionable to have right at the top of prospect rankings, but it was not always so!
We have a particular attachment to Leo(dalis) De Vries who has been our top man ever since the launch of our current shiny tool in August 2024 (with the exception of a two week coup by Kevin McGonigle).
It took until mid-summer 2024 for us to fully get on the De Vries (it was his first pro season and he needed 150 at bats to qualify for our model), but we were already all in on McGonigle back at the start of June. Our first "hot take Tuesday" identified McGonigle as a top-five hitting prospect heading into 2025.
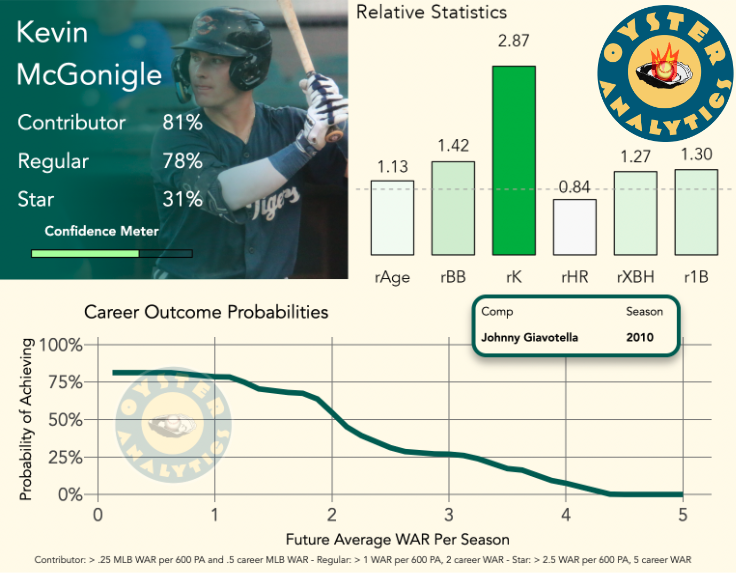
In the 24/25 offseason we identified McGonigle as a top-five hitting prospect
We also locked in on Jacob Wilson, putting him in our top 10 last summer despite skepticism about how his profile would translate to MLB.
With ABS continuing its plodding but unstoppable march towards MLB, we were the first (that we've seen) to get out there and figure out just how the heck teams should challenge balls and strikes, and what they've been doing up to this point in MiLB.
Our main findings: teams don't challenge enough, having a "good eye" at the plate doesn't make you good at challenging, and hitters get the best bang for the buck challenging high pitches. We also found, as the chart below illustrates, that when players are challenging to gain a good result their success rates are better than when they are challenging to avoid a negative result – fear of failure motivates greater aggressiveness.
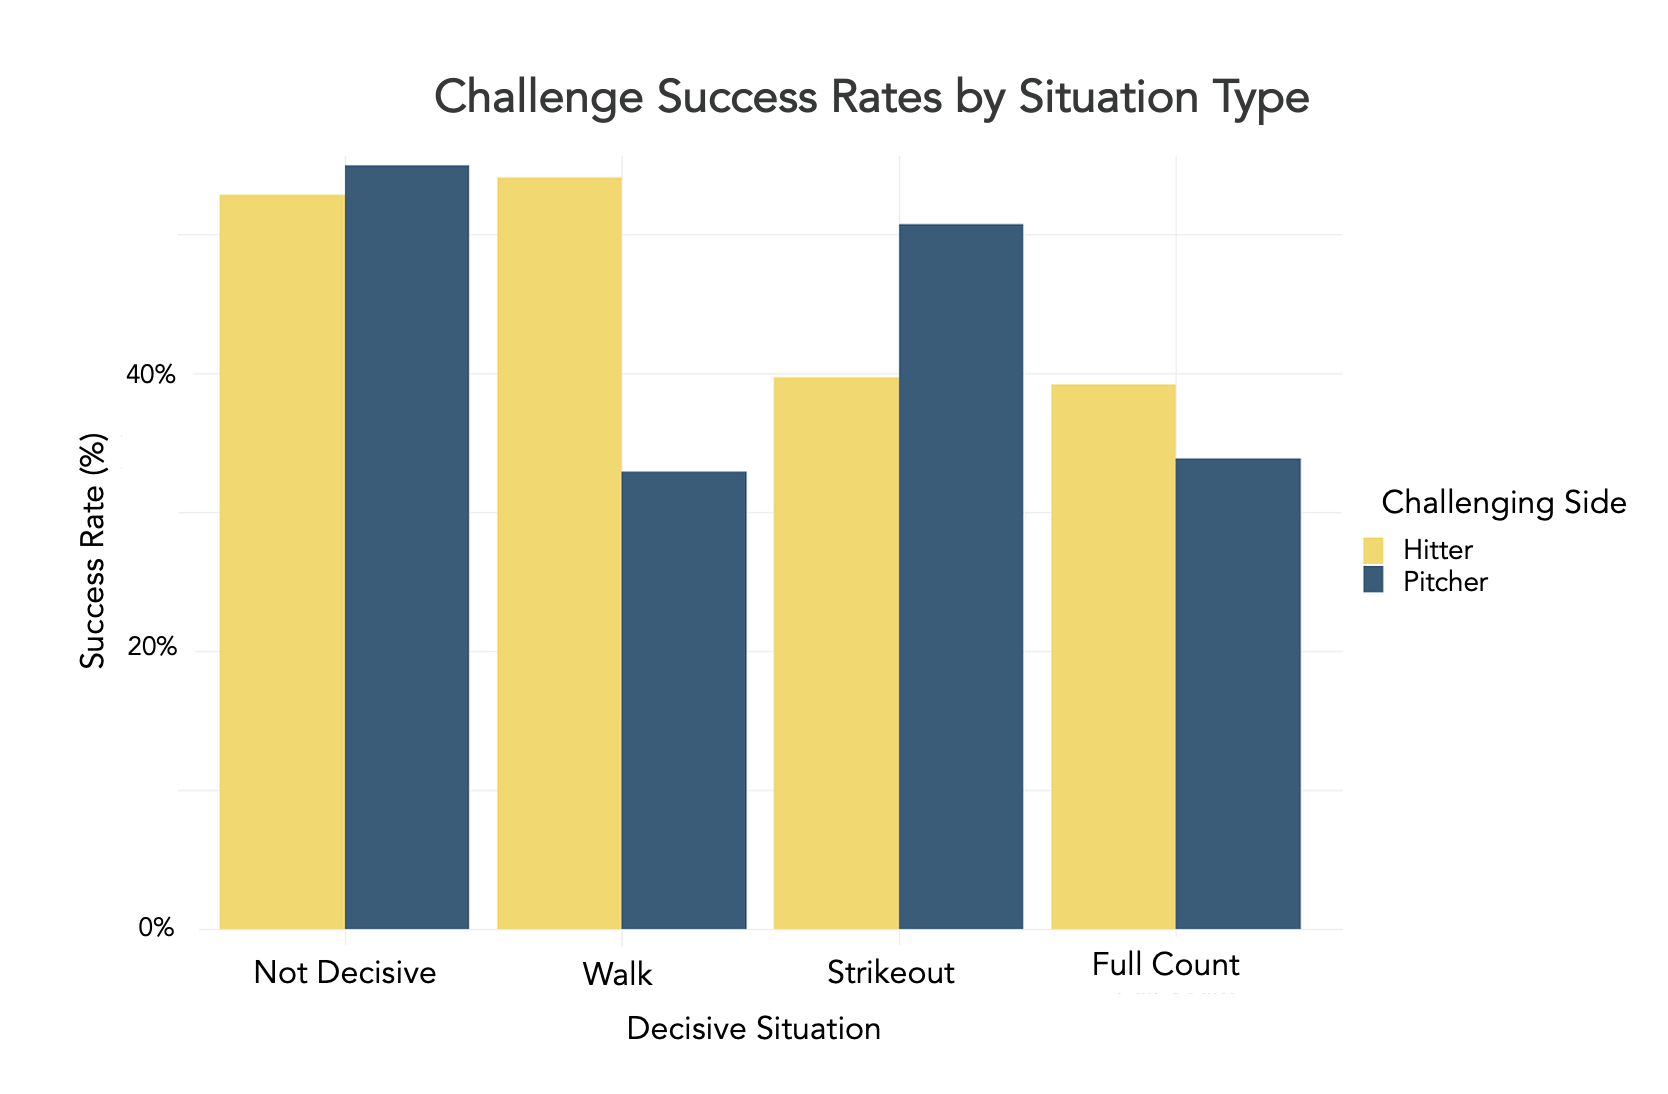
Our research suggests a desperation to avoid negative outcomes leads to more aggressive and less effective challenging
Also featured on Effectively Wild!
We will always have an affinity for Doncon, but it's been shown pretty definitively that he should not have been in our top 50 prospects heading into 2025. We wrote at the time: "He's a guy who hits all the model's favorite traits: a low groundball %, good power, plays SS, and good K%. We'd move him down a bit as his high infield fly ball rates and distance from the bigs cast doubt on his ability to produce, but overall, we'd still rank him far higher than other outlets."
This older version of the model missed a couple things here, which led to changes in our modeling that have improved the reliability and predictive value of our projections. First, Doncon as we noted there was popping balls up to the infield incredibly frequently (his IFFB% in 2024 was an unseemly 41.1%). Second, despite spending the first chunk of 2024 repeating Single-A after a full season there the year before, Doncon's strikeout rate and IFFB% both worsened. These issues have been corrected in the latest version of the model. We now use a metric we call OFFBLD% (percentage of hits that are either outfield fly balls or line drives) in our model instead of groundball rate, and use game log data to include trends in strikeout, walk, and home run rate. While it's never fun to be wrong, the erroneous inclusion of Doncon in our top 50 did help us understand how we could further improve the model.
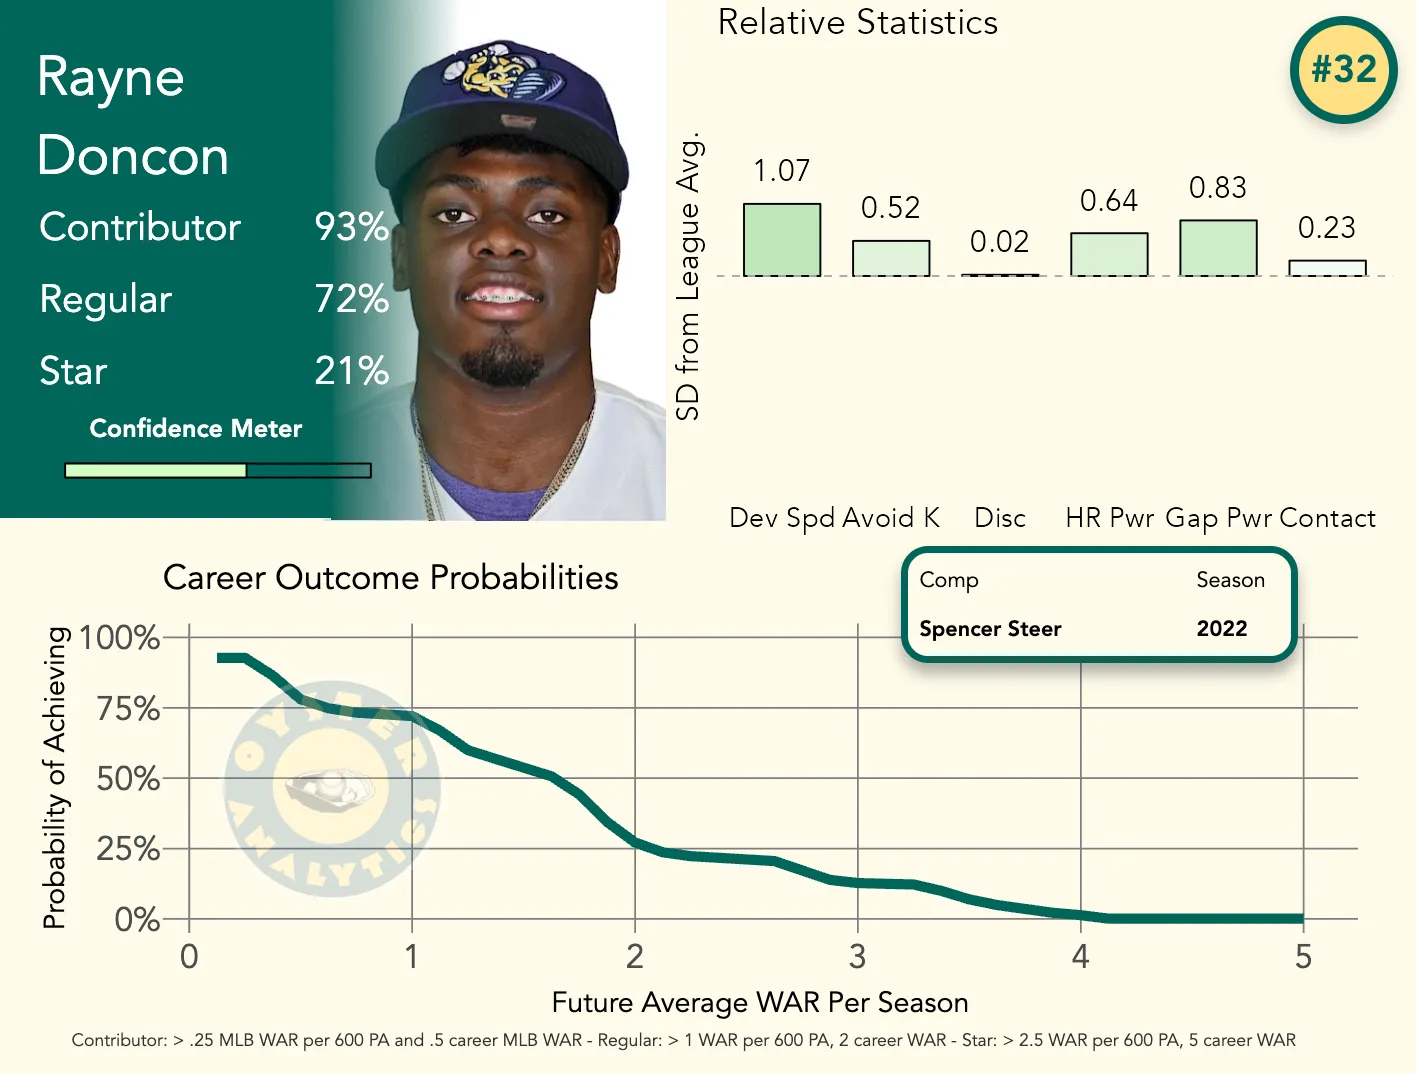
Going into 2025, that version of the Oyster model ranked Rayne Doncon within our top 50, a move that surprised us at the time and has not aged well
Ok, so this article was just about the offenses of the two teams, and predicting series winners is notoriously hard, but this still counts as a miss and a learning opportunity.
In our ALCS preview, we wrote: "The Blue Jays outscored the Mariners against both handedness of pitching in the regular season, but our simulation suggests that the Mariners actually have the stronger playoff starting lineup against both righties and southpaws. We expect a full-strength Mariners lineup to outscore the Blue Jays reasonably handily."
In fact, the Blue Jays outscored the Mariners 32 to 25 in seven games. That could happen by sheer chance, but in this case it was also supported by positive changes that the Jays made to their hitting approach over the course of the season. Multiple key players improved their bat speed significantly in a way that was not fully reflected in the full-season stats that our simulator was trained on.
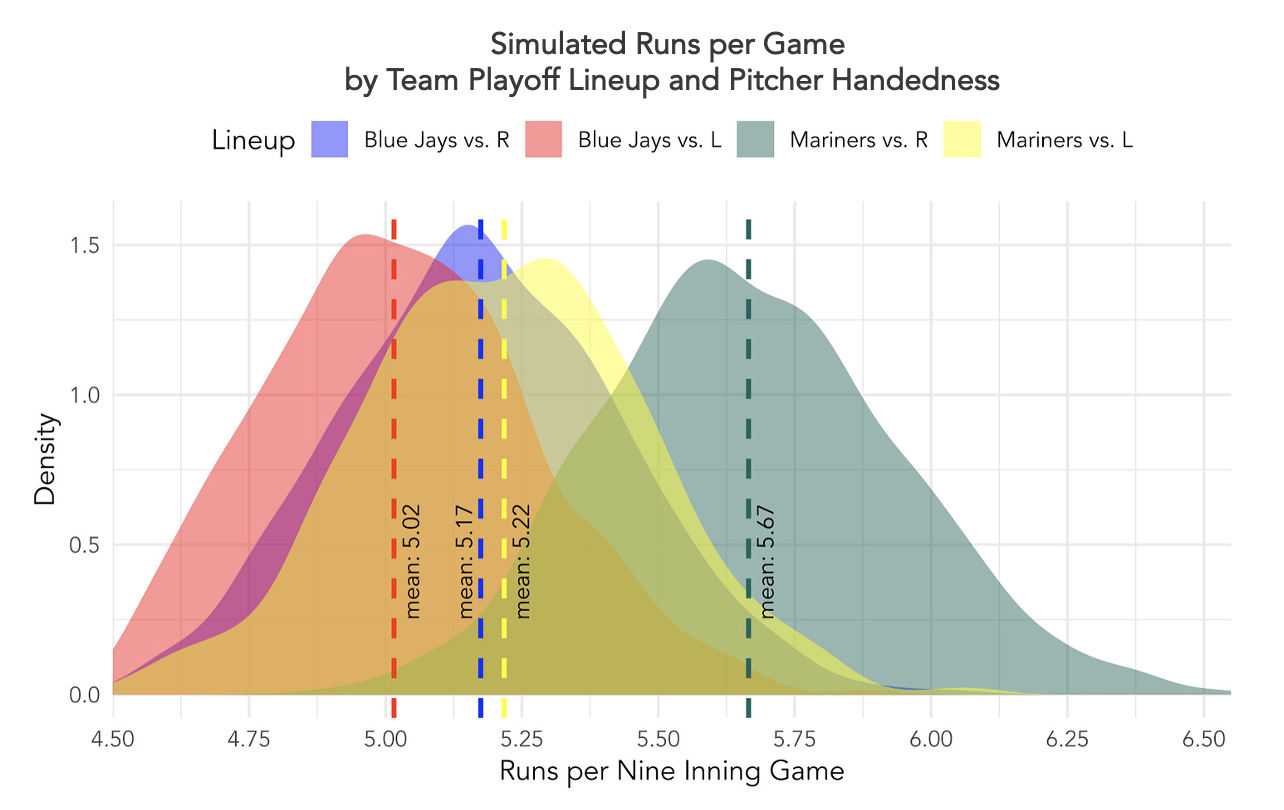
The Mariners offense looked far better than the Jays against RHP in our sim, but we had not accounted for the Jays' positive offensive approach changes during the season